1. Discuss the eight principles of the ISO 9000 standard.
Following are the eight principles of the ISO 9000 standard:
1. Customer focus: Understand the customer’s need and meet their requirements with the aim of exceeding customer’s expectations
2. Leadership: Provide an environment that promotes employee involvement and achievement of objectives
3. Involvement of people: Using the abilities of fully involved employees completely for benefit of the organization
4. Process approach: Processes along with related activities and resources must be managed. Recognize that things are accomplished as a result of processes
5. System Approach to Management: The multiple interrelated processes that contribute to an organization’s effectiveness are a system and should be managed as a system
6. Continual improvement: Continual improvement of the organization and its people, processes, systems and products
7. Factual approach to decision making: Decisions must be based on the analysis of accurate, relevant, and reliable data and information.
8. Mutually Beneficial Supplier Relationships: Both the organization and the supplier benefiting from one another’s resources and knowledge results in value for all.
2. Discuss Pareto Charts.
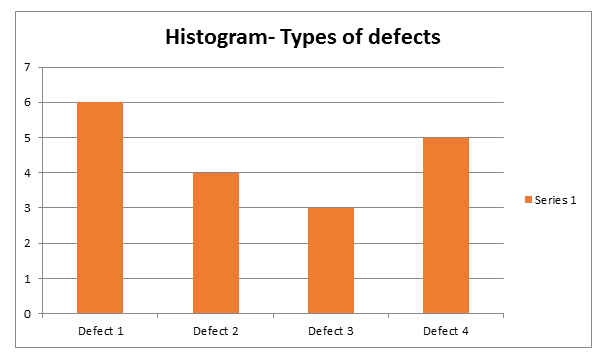
Pareto Chart is a tool to separate important from the trivial and is based on the Pareto principle. The principle states that a minority of causes lead to the majority of problems. It is important to use the resources in the right place to do the most good. Pareto chart shows where to apply the resources by distinguishing the significant few from the trivial many.
Following are the eight principles of the ISO 9000 standard:
1. Customer focus: Understand the customer’s need and meet their requirements with the aim of exceeding customer’s expectations
2. Leadership: Provide an environment that promotes employee involvement and achievement of objectives
3. Involvement of people: Using the abilities of fully involved employees completely for benefit of the organization
4. Process approach: Processes along with related activities and resources must be managed. Recognize that things are accomplished as a result of processes
5. System Approach to Management: The multiple interrelated processes that contribute to an organization’s effectiveness are a system and should be managed as a system
6. Continual improvement: Continual improvement of the organization and its people, processes, systems and products
7. Factual approach to decision making: Decisions must be based on the analysis of accurate, relevant, and reliable data and information.
8. Mutually Beneficial Supplier Relationships: Both the organization and the supplier benefiting from one another’s resources and knowledge results in value for all.
2. Discuss Pareto Charts.
Pareto Chart is a tool to separate important from the trivial and is based on the Pareto principle. The principle states that a minority of causes lead to the majority of problems. It is important to use the resources in the right place to do the most good. Pareto chart shows where to apply the resources by distinguishing the significant few from the trivial many.

The above charts shows the sale of different products in a company. It shows that the company is getting maximum profit by selling product 1 and product 2. Obviously, product 1 and product 2 are the most critical. This suggests that product 1 and product 2 are the company’s core market and all other products represent a marginal business. Hence, decisions on where to allocate resources should be made accordingly.
3. Discuss fishbone diagrams.
A fishbone diagram or cause-and-effect diagram is used to identify and isolate causes of a problem. It helps in visualizing how the various factors associated with a process affect the process’s output. It provides a graphic view of the entire process that is easily interpreted by the brain.
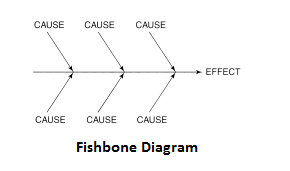
The spine in the diagram points to the effect. The “effect” is the problem we are interested in. Each of the ribs represents a cause leading to the effect. The ribs represent the causes considered to be the major factors. The lower level factors affecting the major factors branch off the ribs. The diagram serves as an excellent reminder that the items noted on it are the things the company needs to pay attention to if the process is to continually improved.
4. Discuss histograms.
Histograms, also known as frequency distribution diagrams are used to chart frequency of occurrence. It is associated with two kinds of data associated with processes namely, attributes and variables data. An attribute is something that the output product of the process either has or does not have. Variables data are something that results from measurement.
A good histogram will show a crisp snapshot of process performance as it was at the time the data were taken, not before and not after.
5. Discuss control charts for variables.
Control chart is a very powerful and effective tool for the tracking and control of processes. Control chart is a sophisticated outgrowth of run charts to overcome the shortcomings of run chart. It is used to separate the special causes from the common causes which helps in evaluating problems and findings solutions for them.
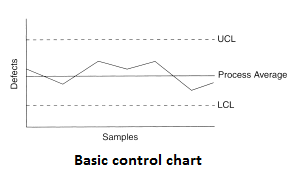
The above figure shows a typical control chart in which data is plotted over time. The data stays between the upper control limit (UCL) and the lower control limit (LCL) while varying about the centerline or average only so long as the variation is the result of common causes (i.e., statistical variation) . Whenever a special cause (nonstatistical cause) impacts the process, one of two things will happen: Either a plot point will penetrate UCL or LCL, or there will be a “run” of several points in a row above or below the average line. When a penetration or a lengthy run appears, this is the control chart’s signal that something is wrong that requires immediate attention. As long as the plots stay between the limits and don’t congregate on one side or the other of the process average line, the process is in statistical control. If either of these conditions is not met, then we can say that the process is not in statistical control.
6. Discuss flowcharts and give a simple example.
A flowchart is a graphical representation of a process and is used for improving processes. The most common flowcharting method is to have the team, which is made up of the people who work within the process and those who provide input to or take output from the process, develop the chart. An effective, completed flowchart must actually reflect the way the processes actually works, not how it should work.
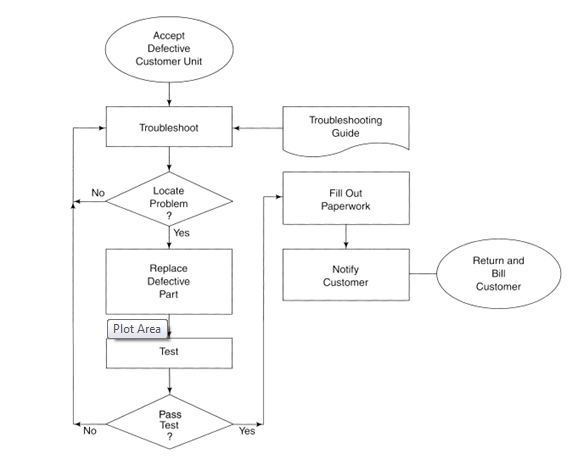
The above flowchart shows the process of an organization which is having major problems with on-time delivery of systems worth $500,000 to $2 million a piece. Several reasons accounted for the difficulty, but a fundamental problem was that they were not getting the input materials on time-even with a 24-month lead time for delivery. One of the first things done was flowchart the entire material system. The chart was started by signing of the customer’s order and completed it at the point where the material was delivered to the stockroom. The chart showed dozens of people involved, endless loops for approval and checking, and flawed sub-processes that consumed time in unbelievable dimensions. The completed flowchart made it clear that the ideal order cycle required 55 weeks.
7. Explain what is an FMEA.
Failure mode and effects analysis (FMEA) tries to identify all possible potential failures of a product or process, prioritize them according to their risk, and set in motion action to eliminate or reduce the probability of their occurrence. FMEA is an analytical tool point to the problems that must be solved through the use of the other tools. FMEA just tries to identify all the possible types (modes) of failures that could happen to a product or a process before they happen. FMEA tells the organization where its resources should be applied, and this is very important because all possible failures are not equal and the organization should always deploy its resources to correct the problems that are most critical.
8. Provide an overview of the Toyota practical problem solving process.
Toyota’s Practical Problem-Solving process has seven main steps and is appropriate for almost all situations, including both latent and existent problem categories. Following are the steps:
1. Perceive the Initial Problem
2. Clarify the Problem – It states that before the action is taken, problem-solvers must grasp the situation. Problem can be analysed by the following:
a. Observe the situation with an open mind.
b. Compare the actual situation to the standard.
c. Determine if variance exists. If not, then try again at step 2.
d. Determine if multiple variances exist.
e. If multiple variances exist, prioritize by severity.
f. Set an improvement objective
3. Determine the actual point of cause (POC), using these questions:
a. Where do we observe the problem geographically, and where in the process or product function?
b. Where is the cause geographically, and where in the process or product function?
4. Determine the root cause. Use the Why analysis:
a. Ask why the observed variance exists.
b. Ask why the answer to that question is as stated.
c. Repeat the “why” question at each succeeding level until the root cause is determined.
d. Use other total quality tools as appropriate.
5. Develop and implement a countermeasure. If multiple solutions are possible, select the one that is most advantageous.
6. Evaluate by analysis before the solution is implemented, and observe and monitor after implementation.
7. Change the standard. The original standard must be charged to reflect the countermeasure.
9. Explain a total quality decision making process.
The decision-making process is a logically sequenced series of activities through which decisions are made. It has the following steps:
· Identify or Anticipate the situation: Anticipating the situation is like driving defensively; never assume anything. Look, listen, ask, and sense.
· Gather the facts: The manager should be able to separate causes from symptoms and determine the root cause of the poor attitude. Only by doing so will the situation be permanently resolved.
· Consider alternatives: Considering the alternatives involves two steps: (1) list all of the various alternatives available and (2) evaluate each alternative in light of the facts.
· Choose the Best Alternative, Implement,Monitor, and Adjust: After all alternatives have been considered, one must be selected and implemented, and after an alternative has been implemented, managers must monitor progress and adjust appropriately.
10. Explain why quality tools are important.
Quality tools are important as they help us to prevent or improve the current processes, services and products. Quality tools like the Pareto charts, cause-and-effect diagram, check sheets, histograms, control charts, stratification, FMEA, flowcharts, five-S, surveys, and design of experiments are used to eliminate waste and reduce errors, defects, and injuries. It helps us to separate important from the trivial, to help identify and isolate the causes of problems, for charting inputs, functions, and outflows of a process in such a way that all the available information makes sense and can be seen together as a whole which wouldn’t be possible without charts.
EXECUTIVE SUMMARY OF SOCIAL NETWORKING ARTICLES:
Autonomous Modules Self-Assemble in Air and Water
This article discusses a recently developed prototype designed by MIT researchers to build structures on their own by activating the connection points using magnetic attractions. The modules are formed autonomously depending on the forces applied and the activated connection points. The researchers aim to build autonomous structures in areas uninhabitable by humans, such as space and disaster areas.
I am fascinated with this idea of building modules with no human interference and without burning fossil fuels. As discussed on Moodle, I agree with most of the participants saying that it is a time-consuming process and have doubts regarding the structural soundness of the self-built modules.
However,I believe it’s just a prototype and is the first step in this technology. I believe it’s going to take lots of time and extensive research to overcome these issues. But once developed, this technology would prove to be fruitful because of the enormous potential and would open doors for further innovation.
Moodle link: http://njit2.mrooms.net/mod/forum/discuss.php?d=64225#p206280
Solar Plane Pioneers Lay Out Round-the-World Flight Plan
The article discusses a single-seat aircraft powered by solar energy which is expected to travel the world. In my opinion, solar energy is a very promising and sophisticated technology. It is definitely going to bring a huge leap in the aviation industry. It will increase the use of renewable sources and would reduce dependency on fossil fuel. One thing which I really look forward to is the amount of emission it would reduce in the long term and how it can reduce global warming. Though there a few things which still need to be figured out, namely, storage and availability of energy in the absence of sun. This is a new technology and with every new thing there are few voids which need to fill. I believe with further extensive study, researchers would be able to find a solution for such problems.
I give a thumbs to Solar Impulse 2.
Moodle link: http://njit2.mrooms.net/mod/forum/discuss.php?d=62944
Renewing Detroit: Dan Gilbert’s Fight Against Blight
The article talks about Detroit, which was once considered to be “Motor City” is now in a state of blight with thousands of abandoned buildings. Dan Gilbert is responsible for $1.6 billion in funds to rebuild the city. He emphasizes on removing all the abandoned structures in the shortest time possible so that more investors can seek growth and can begin the construction of houses and new place for businesses for lower costs.
I agree with the discussions on Moodle. It is right that Detroit needs to be redeveloped but rushing through things might prove to be unhealthy later. I think Dan Gilbert should do proper analysis and see the type of investors coming in. I completely agree with Masroor Khan when she says that a good amount of time should be invested with the right resources to attain the best quality. It is very important to make sure that these newly built buildings are acquired and designed according to needs of the businesses and market.
Moodle link: http://njit2.mrooms.net/mod/forum/discuss.php?d=67711#p206621
